![]()
![]()
Prepared by members and staff of the Emergency Preparedness, Research, Evaluation and Practice Program, Division of Policy Translation and Leadership Development, Harvard T.H. Chan School of Public Health, Boston, MA and the Massachusetts Association of Health Boards, Wellesley, MA.
Version V1.0 – March 9, 2021 – This document was prepared as a resource to help BOHs in Massachusetts make evidence-based decisions regarding their positions on school reopenings in their towns and cities. The report can be tailored for individual towns and cities. This document used some town data specific to the Town of Wellesley. On March 8, 2021, the Wellesley BOH approved a two-page position statement entitled “Position Statement: Achieving Full In-Class Public School Education”. A copy of the Wellesley BOH Position Statement can be found here.Wellesley BOH School Opening Position Statement_PDF and Wellesley BOH School Opening Position Statement_DOC Please feel free to use and modify the Word file to aid in drafting your BOH Position statement.
Contact: Marcia A. Testa, MPH, MPhil, PhD, Massachusetts Association of Health Boards, 20 Walnut Street, STE 110, Wellesley Hills, MA 02481. Send comments to: support@mahb.org
COVID-19 SURVEILLANCE METRICS
Massachusetts Department of Public Health has determined that all COVID-19 surveillance metrics are pointing toward decreasing disease-related adverse outcomes in the State. This trend is most significant for the elderly communities that have been the most negatively impacted by the pandemic in morbidity and mortality. Massachusetts had a 7-day average (2/25/2021– 3/4/2021) percent positivity of 1.79%, with the seventh day of the average indicating a continued decline to 1.48%.[1] In the State’s weekly report (2/9 – 2/23), Wellesley had a 14-day percent positivity rate of 0.5%. [2] Wellesley’s neighboring towns, all other towns, and cities in Massachusetts, and all the New England states reported decreasing percent positivity rates of 2% or less. Nationwide, all states are experiencing declining rates of new COVID-19 cases, hospitalizations, and deaths.
Age-Related COVID-19 Health Outcomes
Initial data from China and Italy indicated that older individuals, especially those over 80 years of age with underlying medical conditions, suffered the highest mortality and morbidity from COVID-19. These trends have continued worldwide. In particular, older, and sicker individuals, especially those residing in in long-term and acute-care nursing facilities, have accounted for nearly all of the COVID-19-related disease burden. Children and adolescents’ mortality and morbidity under age 18 remain near zero. The Centers for Disease Control and Prevention (CDC) uses the 5 – 17 age group as the relative risk reference, as shown in the Table 1 below. The 5 – 17 age group has the lowest risk of infection, hospitalization, and death attributable to COVID-19. Age is overwhelmingly the primary determinant of COVID-19 related morbidity and mortality. As shown in Table 1, Individuals aged 85 and older have 7,900 times the risk of death than K – 12 school-aged children. [3]
Initial data from China and Italy between January and March of 2020 indicated that older individuals, especially those over 80 years of age with underlying medical conditions, suffered the highest mortality and morbidity from COVID-19. These trends have continued worldwide and have not changed. In particular, older, and sicker individuals, especially those residing in long-term and acute-care nursing facilities, have accounted for nearly all of the COVID-19-related disease burden. Children and adolescents’ mortality and morbidity under age 18 remain near zero. The 5 – 17 age group has the lowest risk of infection, hospitalization, and death attributable to COVID-19. CDC Data updated through March 3, 2021 shows that overall, in the United States, 81.1% of all COVID-19 deaths were in individuals 65 years of age and older. [4] As such, not only is the relative risk extraordinarily high as compared to the 5 – 17-year-old age group, but the absolute numbers of deaths make COVID-19 morbidity and mortality outcomes relatively exclusive to those 65 years and older. In the United States the COVID-19 death rate in individuals testing positive is 170 times higher in those over 65 compared to those under age 40 (CDC COVID Data Tracker [5]) .
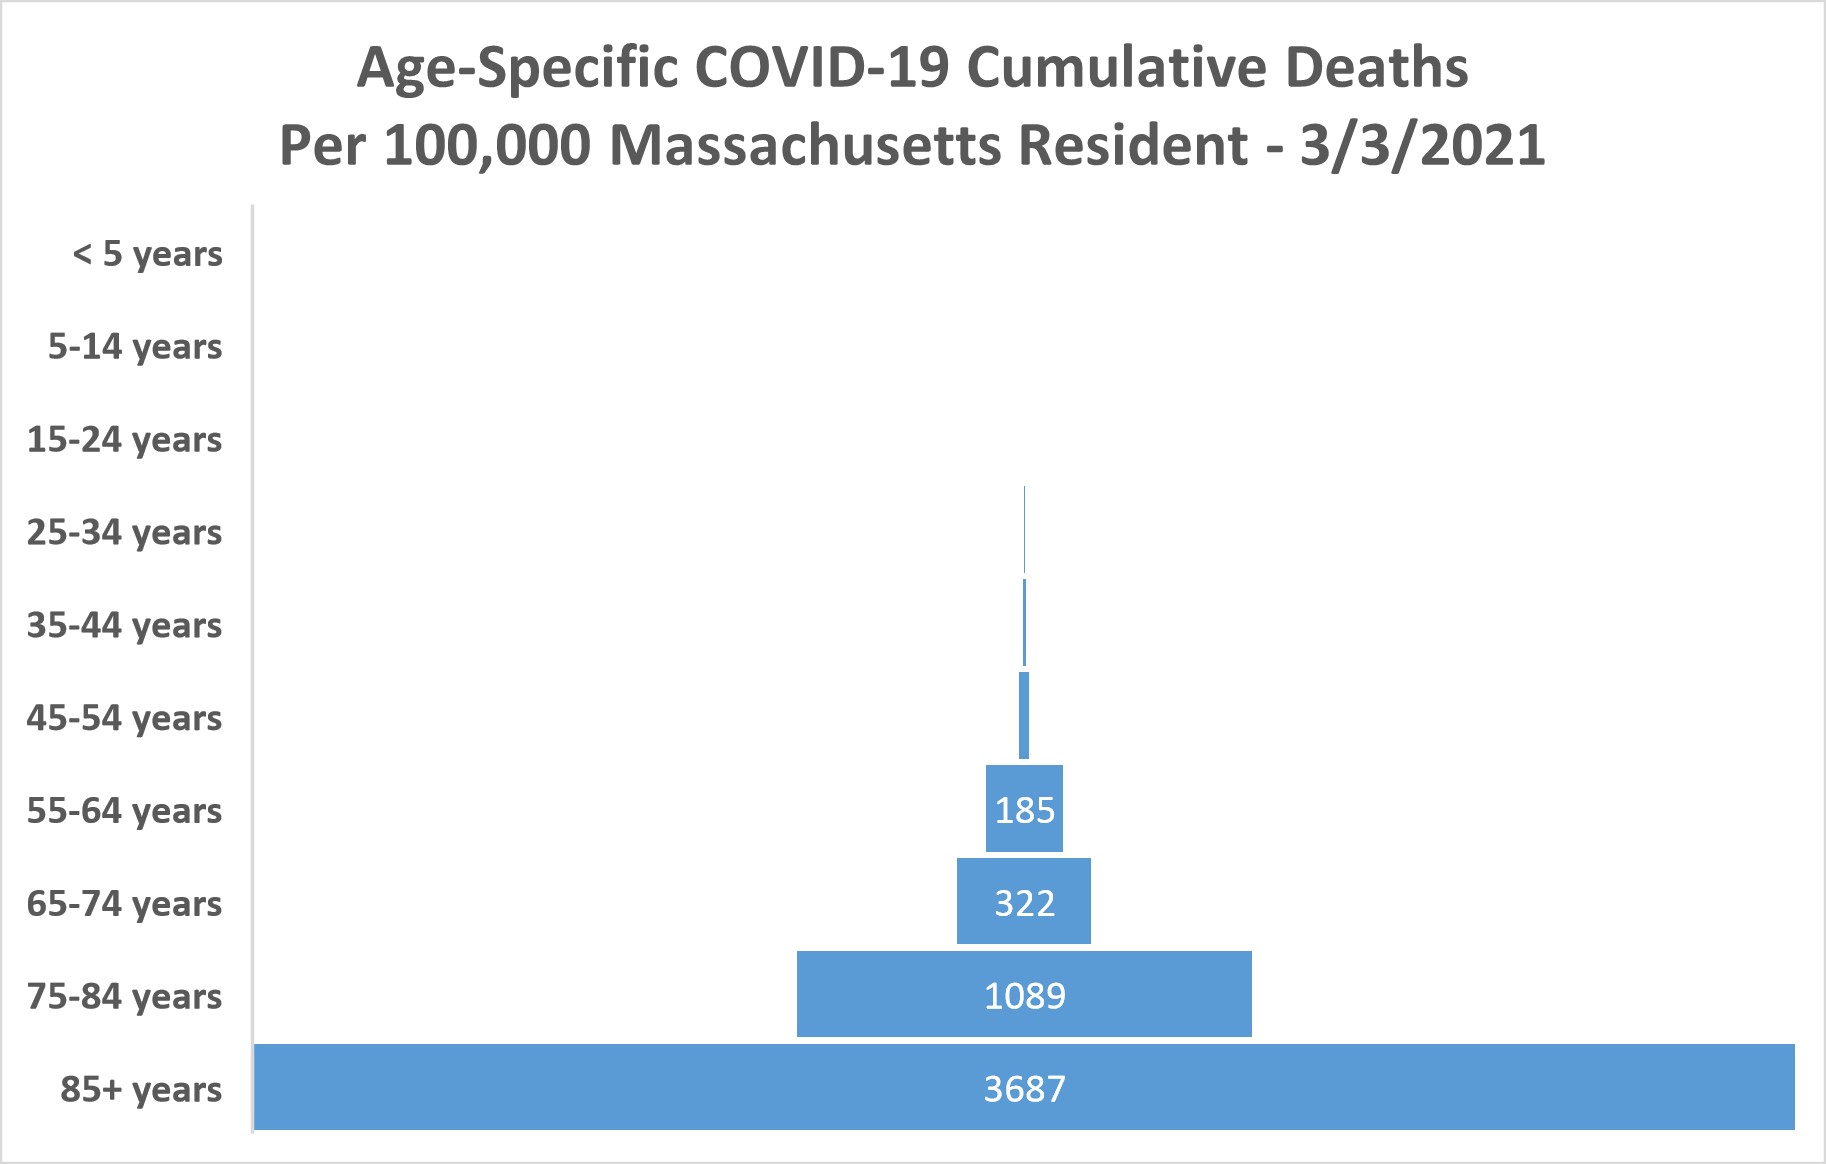
In Massachusetts, the relationship between mortality and age is even striking. The impact of age can be most clearly illustrated by the Figure 1 showing that individuals aged 65 and older account for an even higher number of deaths than the United States as a whole. Figure 1 demonstrates the exponential rise in the percent of COVID-19 deaths with age, 90% of all COVID-19 deaths occurred in individuals 65 years and older. The Figure 2 funnel plot of cumulative deaths per 100,000 elucidates even more strongly the force of mortality and age is even more striking. The impact of age can be most clearly illustrated by the Figure 1 showing that individuals aged 65 and older account for an even higher number of deaths than the United States as a whole. Figure 1 demonstrates the exponential rise in the percent of COVID-19 deaths with age, 90% of all COVID-19 deaths occurred in individuals 65 years and older. The Figure 2 funnel plot of cumulative deaths per 100,000 elucidates even more strongly the force of mortality and highest probability of death in the oldest 85+ age group, in striking contrast to the near zero probability of death in those under 55 years.
Table 1. Risk for COVID-19 Infection, Hospitalization, and Death by Age Group – Click on table icon to enlarge

1. Rates are expressed as whole numbers, with values less than 10 rounded to the nearest integer, two-digit numbers rounded to nearest multiple of five, and numbers greater than 100 rounded to two significant digits. 2. Includes all cases reported by state and territorial jurisdictions (accessed 1/7/2021). The denominators used to calculate rates are based on the 2019 Vintage population. 3. Includes all hospitalizations reported through COVID-NET (https://www.cdc.gov/coronavirus/2019-ncov/covid-data/covid-net/purpose-methods.html, from 3/01/2020 through 1/2/2021). Rates are standardized to the 2019 US standard COVID-NET catchment population. Includes all deaths in NCHS provisional death counts (https://data.cdc.gov/NCHS/Deaths-involving-coronavirus-disease-2019-COVID-19/ks3g-spdg), accessed 1/7/2020)
Figure 1. Percent of all COVID-19 deaths in Massachusetts by age– Updated 3/3/2021. – Click on Figure icon to enlarge

Figure 2. Number of deaths per 100,000 persons by age in Massachusetts from 1/2/2020 through 3/3/2021. – Click on Figure icon to enlarge
Comorbidities Impacting COVID-19 Health Outcomes
In addition to age, the other most significant predictors involve certain comorbidities and behaviors. These conditions can impact individuals of all ages in immune-compromised states from solid organ transplants or other medical conditions or diseases resulting in immune deficiency. There are also specific medical and other human characteristics or behaviors that exacerbate the virus’s virulence in individuals of all ages. For example, medical conditions such as cancer, chronic kidney disease, COPD (chronic obstructive pulmonary disease), Down Syndrome, heart conditions (heart failure, coronary artery disease, or cardiomyopathies), obesity, and severe obesity (body mass index [BMI] of 30 kg/m2 or higher) pregnancy, sickle cell disease, type 2 diabetes mellitus and severe to moderate asthma have been shown to be associated with greater COVID-19 virulence. Smoking has also been shown to increase the risk of adverse COVID-19 outcomes.
Local Town Surveillance and Testing: Wellesley Public School Surveillance Programs
The Wellesley School Committee and School Department, in conjunction with the Wellesley BOH and Health Department have been conducting weekly COVID-19 surveillance using pooled testing. This testing has allowed the data analysis of faculty, staff, student case rates, and contact tracing for all Wellesley public school buildings since the start of the school year. The results have demonstrated that current mitigation protocols in all Wellesley Public School buildings effectively eliminate the risk of person-to-person transmission. These results are posted weekly as part of the Public-School Reopening Measures Dashboard located on the Town of Wellesley website Covid Dashboard | Wellesley Public Schools (wellesleyps.org). This robust testing program has provided further empirical evidence that even a silent person-to-person spread is not occurring. Teachers have been providing in-person education since October 2020 with not a single instance of student-to-teacher transmission of infection.
MITIGATION EFFORTS AND CHANGES
Non-Pharmaceutical Interventions: Physical Distancing
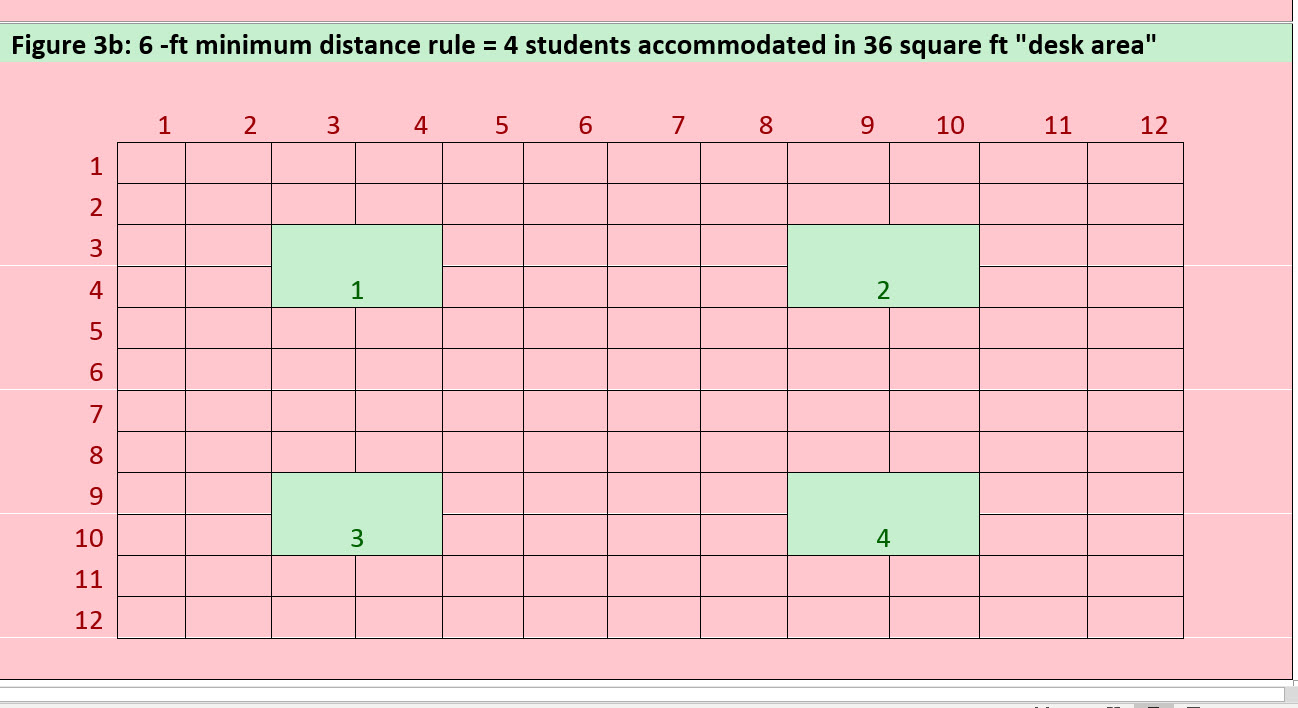
The space required to separate students and teachers remains one of the biggest challenges to in-person instruction during the pandemic. The World Health Organization physical distance guidelines are closer to 3 feet than 6 feet. A 36 square-foot desk area that normally could accommodate 16 students using the 3-foot capacity rule, can only accommodate 4 student (25%) of those study under the six-foot rule (Figure 3). The CDC’s recently release guidance stressed that the larger 6-ft distance should be used when community spread is high.[6] The single biggest obstacle to fully reopening schools is the 6-foot distancing requirement, as most schools do not have the physical space or staffing to bring all students back five days a week with this distancing in place.
Figure 3a. 3 -ft minimum distance rule = 16 students accommodated in 36 square feet “desk area” – Click on figure icon to enlarge
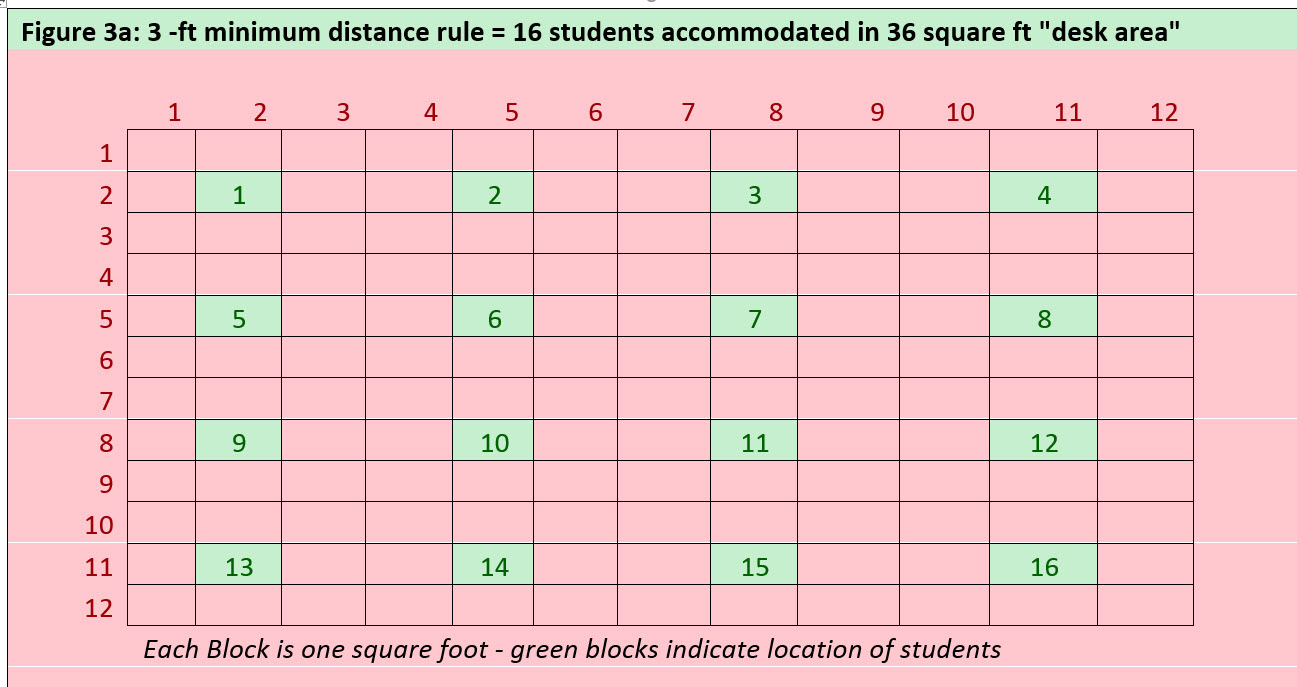
Figure 3b.6 -ft minimum distance rule = 4 students accommodated in 36 square feet “desk area” Click on figure icon to enlarge
The 6-foot distancing guideline has been a rule of thumb since the 1800s, in the earliest studies of infection spray in sneezes and coughs. However, a 2020 large research analysis at the Massachusetts Institute of Technology’s Fluid Dynamics of Disease Transmission Laboratory, found both 3-foot and 6-foot rules “outdated,”. Using new technology, the MIT’s DDTL found the risk of airborne transmission of COVID-19 was based not on simple distance, but whether people were in a generally crowded area, a well- or poorly ventilated space, whether they were wearing masks, and whether they were speaking softly or loudly, among other factors as the chart in Figure 4a below shows.
Figure 4a: Risk of Transmission Chart — MIT — Source – the BMJ – Click on figure icon to enlarge

A 2020 meta-analysis published in the Lancet identified 172 studies that researched how far physical distances needed to be to reduce transmission. Studies were all observational and no randomized trials were identified. Of the 172 studies, 66 focused on how far a virus can travel by comparing the association of different distances on virus transmission to people (appendix pp 42–44). Of these 66 studies, five were mechanistic, assessing viral RNA, virions, or both cultured from the environment of an infected patient. In brief, the study found that across 16 countries, social distancing of at least 3.3 feet (1 meter) as compared to closer distances led to significantly lower transmission rates when baseline infection rates were 50%. The important take away here was that this association between less than 3 feet and increased risk was only found in high risk for infection. As shown in Figure 4b below, low baseline risk for infection of 1%, had 0 absolute risk, regardless of whether you were 0, 1, 2, or 3 meters apart. The infection rate in K-12 students is less than a fraction of one percent. The reason that there are no studies comparing 3 feet to 6 feet is that that with baseline rates of the magnitude of K – 12 are near zero making any alternative hypothesis of a lower risk intractable.
Figure 4b. Change in absolute risk of transmission from an individual infected with SARS-CoV-2, SARS-CoV, or MERS-CoV with varying baseline risk and increasing distance (B). SARS-CoV-2=severe acute respiratory syndrome coronavirus 2. SARS-CoV =severe acute respiratory syndrome coronavirus. MERS-CoV=Middle East respiratory syndrome coronavirus. Click on figure icon to enlarge

To achieve the goal of five full-days a week of in-person school for all students, most schools currently using a 6-foot physical distancing guideline will have to adopt a distance of between 3 and 6 feet inclusive. For example, under the hybrid model, if 50% of students attend two days, bringing students back would require room for twice the number of cases, which would require a 4-ft rule as shown in Figure 5. All students would be facing toward the front of the room. The teachers desk could be placed in the back of the class facing the back of students with screens in the front as needed.
Figure 5: 4-ft minimum distance rule = 9 students accommodated in 36 square ft “desk area” – Click on figure icon to enlarge
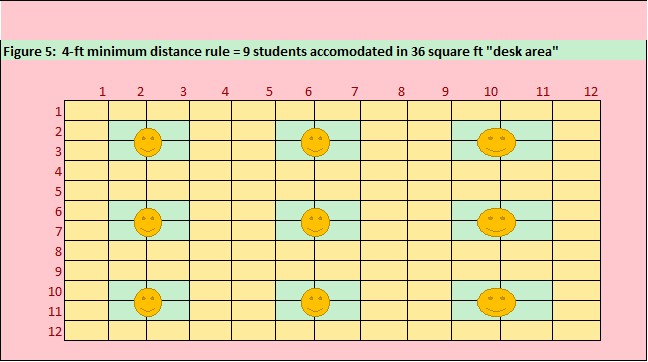
Adults in the building could maintain a distance of 6 feet from each other and, as much as possible, from students. All students and staff should keep 6 feet of distance during mask breaks, including eating and drinking. The standards should be maintained regardless of case rates in the town, county or state, so long as in-school transmission rates remain low, and be followed until herd immunity is well established.
If the hybrid model is accommodating the 6-ft rule and 50% of students, it is assumed that settings where a minimum of 3 feet of distancing cannot be achieved due to the number of students, would be rare. However, continued creativity by school administrators in use of both indoor and outdoor space as the weather becomes warmer would be needed. Resourcefulness is always needed to restructure meals safely, but this should not prevent moving ahead with this change in spacing. Scientific data suggest no appreciable difference in risk between 3 feet and 6 feet in low disease prevalence settings, as in Wellesley schools. More importantly, real-world data from across the world, including countries in Europe and Asia where 3 feet ,or 1 meter, is the standard, demonstrate no increased risk of transmission when other mitigation measures, especially masks, are in place.
The CDC’s transitioning indicators on school reopening report stated that “K-12 schools should be the last settings to close after all other mitigation measures in the community have been employed, and the first to reopen when they can do so safely. This implies that schools should be prioritized for reopening and remaining open for in-person instruction over nonessential businesses and activities.”. [7]
Natural and Vaccine Immunities to COVID-19.
As of February March 5, 2021, there have been 557,802 laboratory-confirmed cases of COVID-19 in Massachusetts. Models from the CDC indicate that the actual number of infections in the United States could be three to four times higher than laboratory confirmed cases because of the high incidence of asymptomatic disease. Previous infections’ natural immunities add to those rapidly being acquired by mass vaccination programs now underway. The Wellesley Board of Health members agree with Federal and State public health authorities that vaccination for all teachers regardless of age and comorbidities should not be a prerequisite for students’ return to full in-class schooling. As described above, in order to prevent hospitalization and death, the most vulnerable individuals’ vaccination is much more critical, as was illustrated in Table 1. Since the age-morbidity and mortality relationship has been known as early as March 2020, the original concern of COVID-19 community spread through associations among K – 12 students, faculty and staff was that asymptomatic or mildly symptomatic individuals (mostly young and healthy) would unknowingly infect their older grandparents, relatives, and friends without ever knowing they were positive, or before testing positive. With the older and medically compromised groups currently undergoing mass vaccination and practicing social distancing and mask wearing while waiting to be vaccinated, the risk of disease transmission and spread among young healthy children and adults is of much less concern.
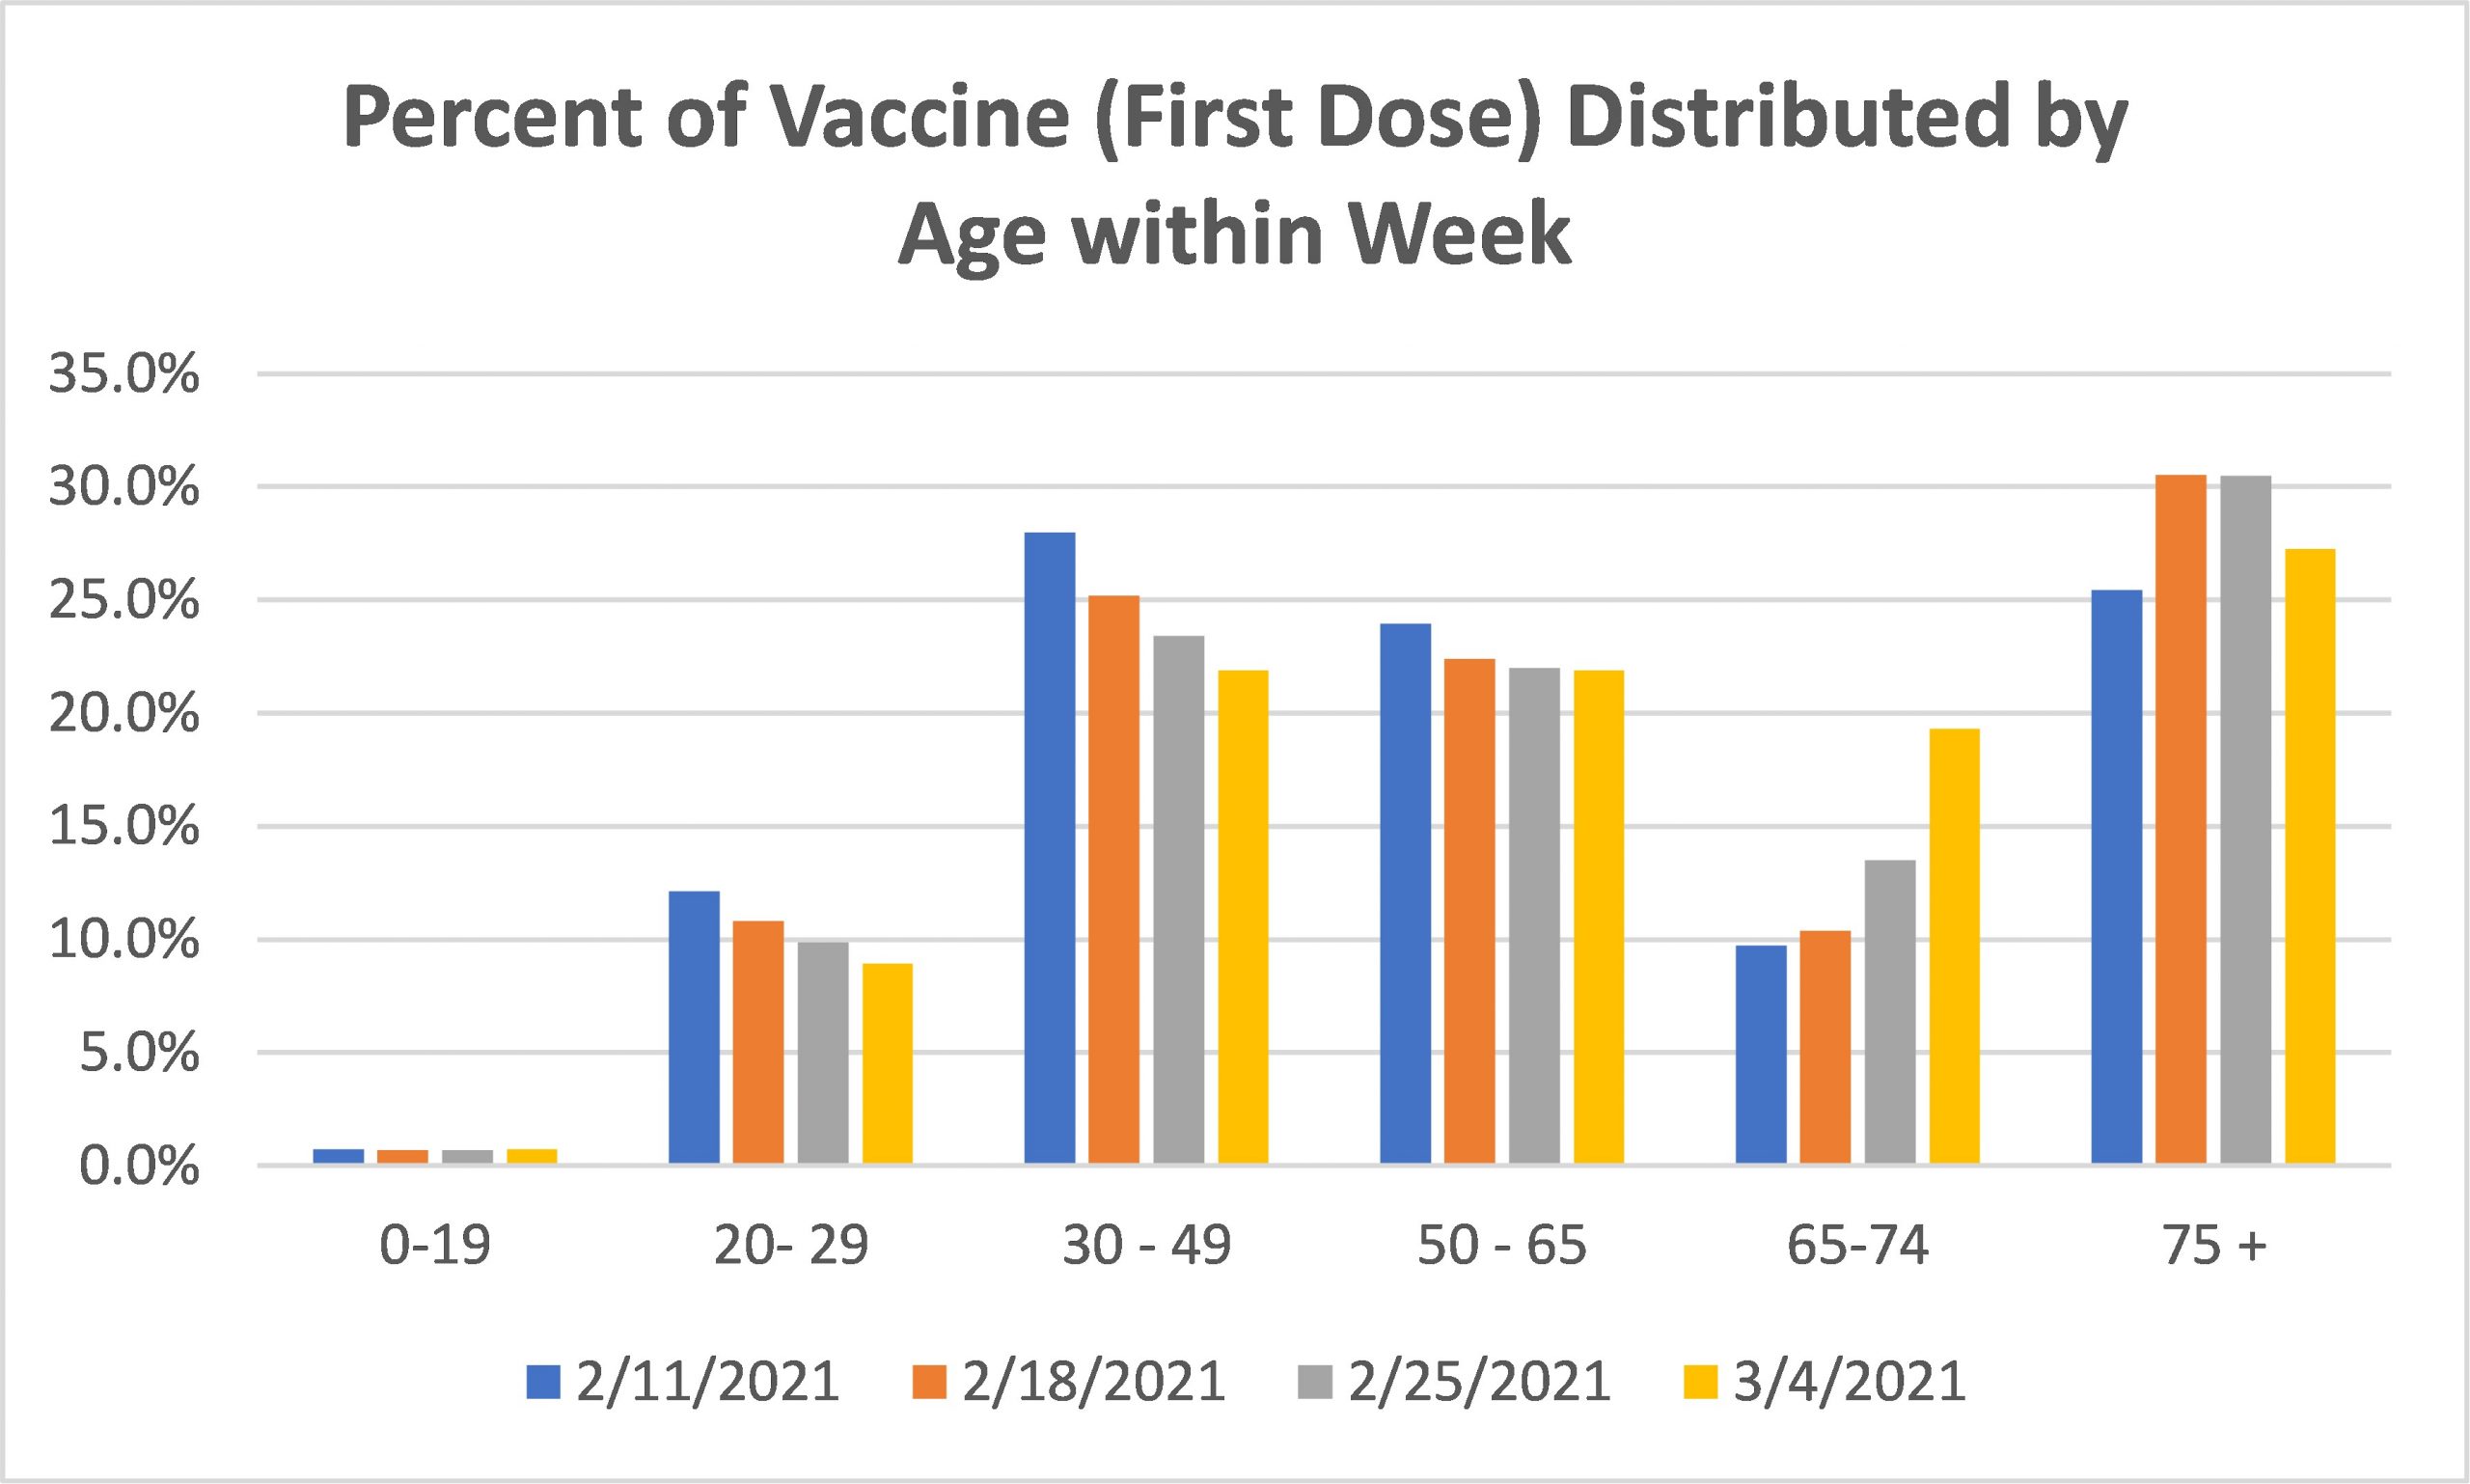
Current COVID-19 Vaccines are FDA approved to protect the vaccinated individual from having severe symptomatic disease by providing immunities. While vaccination might reduce transmission rates in asymptomatic COVID- positive individuals due to lower viral load, this has not yet been demonstrated The primary goal of public health vaccination programs is to build immunities in the population of individuals who carry the greatest disease burden. At this time, nearly all individuals in long-term nursing facilities have been vaccinated under the federal pharmacy program. In Massachusetts, as of 3/4/2021, 1,281,680 million individuals have received a first vaccine dose with 587,167 of those fully vaccinated. Most of those individuals vaccinated prior to February 11, 2021 were young, healthy workers connected to clinics and hospital employment regardless of whether they encountered patients. Not until the 75+ age group became a priority for vaccination have the most vulnerable begun to receive protection to reduce hospitalization and death by 75%.
Figure 6: COVID-19 Vaccine (first doses) distributed by age within week in Massachusetts. Click on figure icon to enlarge
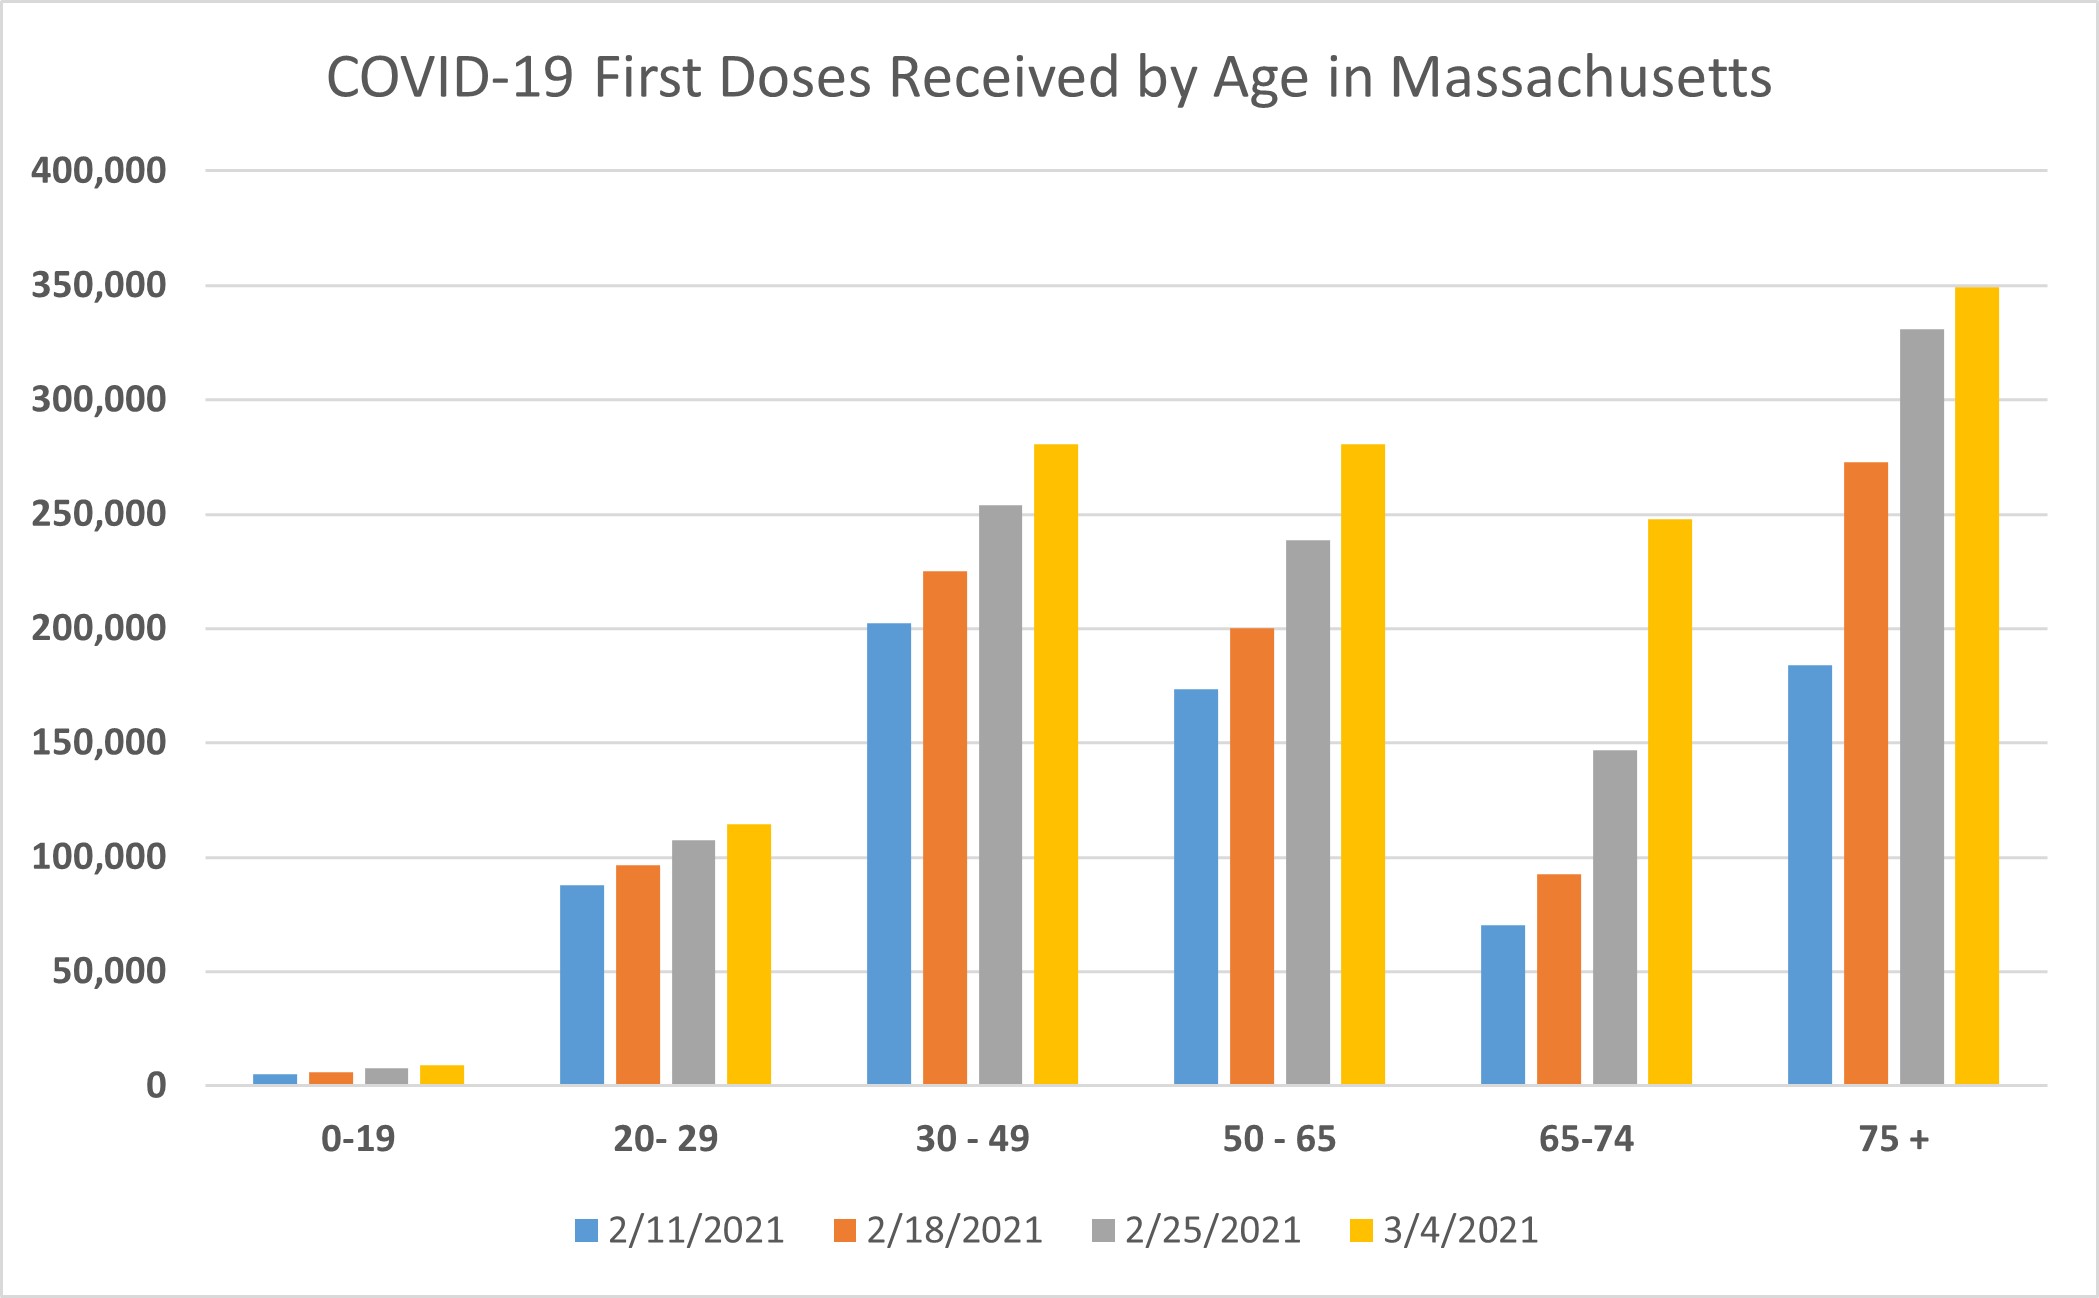
Figure 7:Percent of COVID vaccine (first dose) distributed by age within week in Massachusetts. Click on figure icon to enlarge
Risk of COVID-19 Morbidity and Mortality in Unvaccinated Wellesley Faculty and Staff
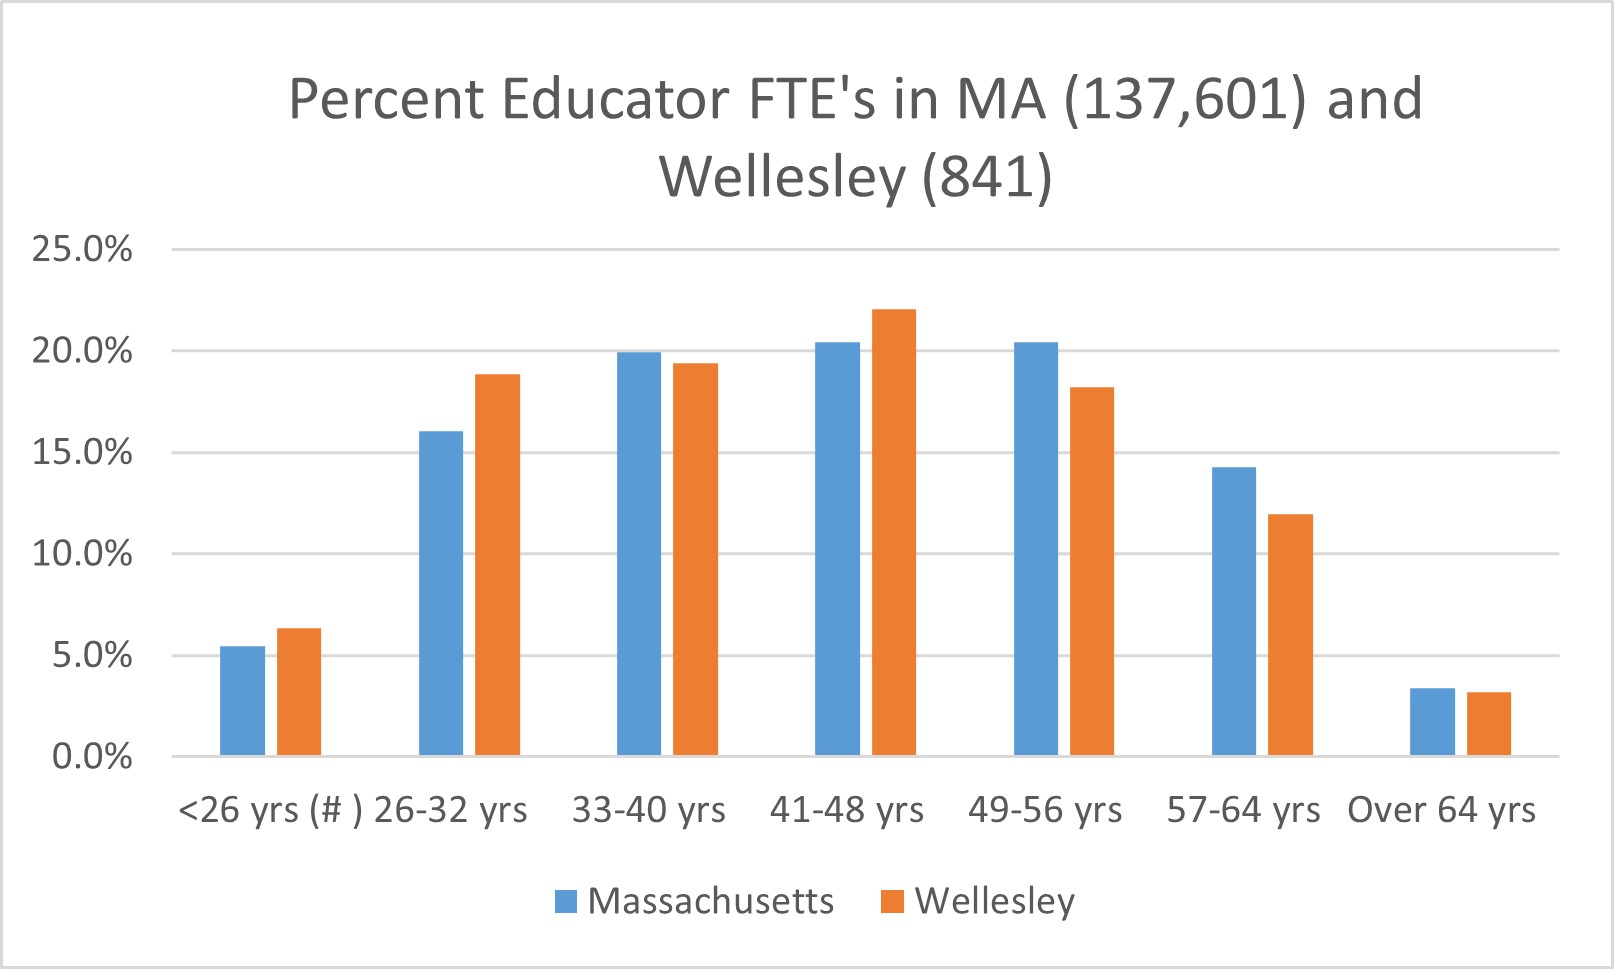
All K – 12 faculty and staff in Massachusetts become eligible to schedule a vaccine appointment as of March 11, 2021. However, more importantly, is that individuals aged 65 and older group should all be fully vaccinated. If so, then mortality among all COVID-infected individuals in the Massachusetts should be reduced by the percentage of COVID deaths in that age group. As indicated previously, for Massachusetts that would be 90%. Hypothetically, if that group of 1,074,425, 65 and older individuals had been the first to be vaccinated, by March 7, 2021, all would be fully vaccinated, the reduction in deaths be observed going forward. The age distribution of Massachusetts educators is shown in the table below.[8] The distribution of Wellesley is nearly identical to that of the state overall (Figure 6). For both jurisdictions, 97% of individual are under age 65, 82.4% 56 and younger and 61.9% 48 years and younger.
Figure 8: Age Distribution of K – 12 Educators in Massachusetts (n = 137,601) and the Town of Wellesley (n = 841). Click on figure icon to enlarge
If one considers all School Department staff, the percentages are relatively similar, with a slightly higher age distribution as shown below. (Click to enlarge)
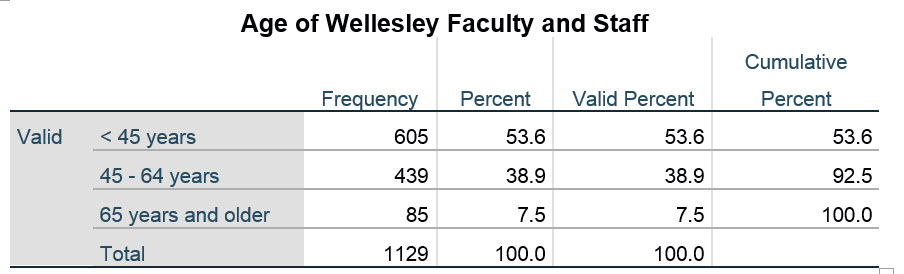
Over 50% of faculty and staff are younger than 45 years, which has shown minimal disease burden. As mentioned previously, the original impetus for remote learning was to reduce transmission within schools to protect older individuals within the faculty, staff, and student households. However, the efforts to vaccinate the most vulnerable individuals has already dramatically reduced the risk of hospitalization due to COVID-19. Public health recommendations for vaccination have always followed the guidelines of vaccinating the most vulnerable in order to reduce morbidity and mortality due to transmission from the least vulnerable asymptomatic population. The rationale is that once all individuals at higher risk of death or severe disease are immune, they are no longer at risk when contacting young, healthy individuals who are either asymptomatic or manifest mild symptoms such that the disease goes undetected. The global experience has clearly shown that rising case rates in the community do not translate into increased person-to-person transmission in the schools in that community. Schools are likely to be a safer place for students and staff than their own homes or other places in their community with less stringent rules and safety measures. It has been suggested that remote and hybrid learning models actually increase rates of transmission when children and adolescents socially congregate outside of school without the supervised physical distancing, hand washing and masking.
PUBLIC HEALTH INFECTIOUS DISEASE MITIGATION STRATEGIES AND POTENTIAL ADVERSE EFFECTS
When evaluating the safety and efficacy of any drug or device treatment or public health mitigation strategy one always has to consider the negative consequences or “adverse events” attributable to the treatment. For new drug applications (NDAs) submitted to the FDA, the approval application must show clearly that the benefits outweigh the risks. The research process to establish this takes several years of basic science, physiologic and clinical trials research. In the end, the final decision does not require that the new drugs and devices be 100 percent safe, but rather that the totality of the evidence supports a therapeutic claim that the benefits of treatment outweigh the risk at the population level. When making decisions about the use of public health mitigation strategies, the same risk-benefit equation must be considered. Handwashing and environmentally safe sanitizing and ventilation as preventative measures for infection disease control have not been shown to have any adverse effects at any level. The same is true with wearing personal protective equipment and putting up other types of contact shields and barriers. Brief periods of school lockdowns, such as those that were imposed during the H1N1 epidemic in Mexico from April 23, 2009 through May 10, 2009 also have minimal impact.
The case of school closure beyond a few weeks had never even been contemplated, especially for a disease that had virtually no adverse impact on school-aged children and where school-aged children were not the vectors of transmission. Knowing that the mitigation effort would afford no benefit to those impacted, the negative health impact should have been very closely monitored. A number of recent public health and clinical “look-back” reports have confirmed that mental, emotional, cognitive, and physical adverse effects from result from school and business closure as well as from social isolation of individuals of all ages.
Mental, Emotional, Cognitive and Physical Adverse Effect from Social Isolation and Remote Learning
While even a brief review of the literature on the topic of the adverse effects of social isolation during COVID-19 is beyond the scope of this report. At the beginning of the (COVID-19) pandemic, many governments throughout the world made the decision to close any type of school, including day cares and universities. This was because it was thought that, as previously demonstrated by the influenza viruses, children were among the major spreaders of severe acute respiratory syndrome coronavirus 2 (SARS-CoV-2) and that by keeping them at home, a significant number of new COVID-19 cases could have been prevented. However, school closure during COVID-19 pandemic was strongly criticized by several experts [9] who reported that the assumptions on which this decision was based were not at all proven and that closing schools could have caused social, economic and health problems even more common and more severe than those due to COVID-19. The authors of this opinion reviewed several studies and concluded that schools should remain open, despite COVID-19 pandemic. However, several problems strictly related to school frequency and reduction of infectious risk must be solved before school attendance can be considered completely safe. A single more in-depth guideline agreed between countries with the same school problems could be very useful in eliminating doubts and fostering the compliance of students, teachers and non-teaching school staff reducing errors and misinterpretations.[10]
SARS-CoV-2 infection at school. One study point out that children and families are particularly affected by negative consequences. [11] These consequences encompass containment measures, such as childcare and school closures with separation and isolation from children’s social groups and friends, contact restrictions, quarantines, the loss of freedom and opportunities for movement and play, increased boredom, the discrimination against affected families, insecurity of adult caregivers with increased familiar stress and domestic conflicts, adverse effects on children’s educational opportunities and impacts on parent’s employment [12] . The first study to assess COVID’s mental health impact across the lifespan in the United States in adolescents, adults, and health care workers found that the COVID‐19 pandemic is associated with increased rates of clinically significant psychiatric symptoms, and that loneliness could put individuals at increased risk for the onset of more severe psychiatric disorders.[13]
Physical consequences from lock down and school closures can negatively impact the ability of the child to exercise and control food consumption leading to an unhealth sedentary lifestyle, overweight and obesity in children. [14] This review concluded that COVID-19 restrictions disrupted the everyday routine of children, adolescents and young adults and elicited changes in their eating behaviors and physical activity. One area that has received little attention is that worsening vision can be directly linked to COVID-19 school closures. One cross-sectional study included 194,904 photoscreening tests conducted in 123,535 children, and found a substantial myopic shift (−0.3 diopters) after home confinement due to COVID-19 for children aged 6 to 8 years. The prevalence of myopia increased 1.4 to 3 times in 2020 compared with the previous 5 years. [15] Home confinement due to coronavirus disease 2019 appeared to be associated with a substantial myopic shift in children; younger (aged 6-8 years) children’s refractive status may be more sensitive to environmental changes than older children, given that they are in an important period for the development of myopia. Another vision-related adverse events study concluded that the public health measures imposed in many countries to slow the spread of the novel coronavirus (COVID-19) outbreak could have substantial negative effects on children’s physical and mental health. The authors describe four cases of acquired concomitant acute esotropia likely caused from excessive application of near vision during the COVID-19 lockdown. [16] Another study that found an increased risk of worsening myopia due to the amount of screen time required for remote learning. [17] This study found that increased digital screen time, near work, and limited outdoor activities were associated with the onset and progression of myopia, and could potentially be aggravated during and beyond the COVID-19 pandemic outbreak period. While school closures may be short-lived, increased access to, adoption of, and dependence on digital devices could have a long-term negative impact on childhood development. Raising awareness among parents, children, and government agencies is key to mitigating myopigenic behaviors that may become entrenched during this period. posited that while it is important to adopt critical measures to slow or halt the spread of COVID-19, close collaboration between parents, schools, and ministries is necessary to assess and mitigate the long-term collateral impact of COVID-19 on myopia control policies.
CONCLUSIONS
Educators, parents, and students may experience concern when faced with the prospect of a larger cohort of students in classrooms, lunchrooms, and gyms. However, the absence of clusters of student-to-student or teacher-to-student transmission in Massachusetts schools should be reassuring. It is important to remember that there will never be zero risks for any type of infectious disease in schools or any danger, infectious or otherwise. Being socially and emotionally distanced from one’s teachers and friends is having a profound and growing negative impact on the mental health, emotional wellbeing, development, and education of Massachusetts children. After the one-year mark since schools were first closed on March 17, 2021 due to the pandemic, we believe that the growing risk of this negative impact exceeds the threat from the virus.
Notes: Please refer to the “Further Readings” section below for additional information. This section will be updated as required.
Contributors
Marcia A. Testa, MPH, MPhil, PhD, Senior Lecturer on Biostatistics and Director (EPREP) 1,2; Elena Savoia, MD, MPH, Senior Research Scientist1;Rachael Piltch-Loeb, PhD, Preparedness Fellow1;Johanna F. Hayes, ScM COVID-19 Affiliate Lead Manager 2
Affiliations
1. Department of Biostatistics and Emergency Preparedness Research Evaluation and Practice Program, Division of Policy Translation and Leadership Development, Harvard T.H. Chan School of Public Health, Boston, MA
2. Massachusetts Association of Health Boards, 20 Walnut Street, Suite 110, Wellesley Hills, MA.
Further Readings
Centers for Disease Control and Prevention. Science Brief: Transmission of SARS-CoV-2 in K-12 schools. Updated February 12, 2021. Science Brief: Transmission of SARS-CoV-2 in K-12 schools | CDC. Accessed on March 8, 2021.
REFERENCES
Web Links and URLs
[1] Massachusetts Department of Elementary and Secondary Education. 2019-20 Educators by Age Groups Report (District) – Full-time Equivalents – https://profiles.doe.mass.edu/statereport/agestaffing.aspx Accessed on March 5, 2021.
[2] Centers for Disease Control and Prevention. Operational Strategy for K-12 Schools through Phased Mitigation https://www.cdc.gov/coronavirus/2019-ncov/community/schools-childcare/indicators.html (copy and paste URL). Accessed on March 5, 2021.
[3] Centers for Disease Control and Prevention. Operational Strategy for K-12 Schools through Phased Mitigation – Updated February 26, 2021. https://www.cdc.gov/coronavirus/2019-ncov/community/schools-childcare/operation-strategy.html#executive-summary (copy and paste URL). Accessed on March 5, 2021.
[4] Massachusetts Department of Public Health. COVID-19 Interactive Data Dashboard. Released on March 6, 2021. Data current as of March 5, 2021. https://www.mass.gov/info-details/covid-19-response-reporting#covid-19-interactive-data-dashboard- (copy and paste URL) Accessed March 6, 2021.
[5] Massachusetts Department of Public Health. Weekly COVID-19 Public Health Report. Released on February 25, 2021 6, 2021. Data current as of February 23, 2021. https://www.mass.gov/doc/weekly-covid-19-public-health-report-february-25-2021/download. Accessed on February 25, 2021.
[6]Centers for Disease Control and Prevention. Risk for COVID-19 Infection, Hospitalization, and Death By Age Group. Data Update February 18, 2021. https://www.cdc.gov/coronavirus/2019-ncov/covid-data/investigations-discovery/hospitalization-death-by-age.html. Accessed on March 5, 2021.
[7] National Center for Health Statistics. Centers for Disease Control and Prevention. Provisional COVID-19 Death Counts by Sex, Age, and State. https://data.cdc.gov/NCHS/Provisional-COVID-19-Death-Counts-by-Sex-Age-and-S/9bhg-hcku. Accessed on March 5, 2021.
[8]Centers for Disease Control and Prevention. COVID Data Tracker. https://covid.cdc.gov/covid-data-tracker/#datatracker-home (copy and paste URL). Accessed on March 5, 2021.
Published References
[9] Esposito S, Principi N. School closure during the coronavirus disease 2019 (COVID-19) pandemic: an effective intervention at the global level? JAMA Pediatr. 2020. https://doi.org/10.1001/jamapediatrics.2020.1892.
[10] Esposito S, Cotugno N, Principi N. Comprehensive and safe school strategy during COVID-19 pandemic. Ital J Pediatr. 2021;47(1):6.
[11] Boldt K, Coenen M, Movsisyan A, et al. Interventions to Ameliorate the Psychosocial Effects of the COVID-19 Pandemic on Children-A Systematic Review. Int J Environ Res Public Health. 2021;18(5).
[12] Brooks, S.K.; Webster, R.K.; Smith, L.E.; Woodland, L.; Wessely, S.; Greenberg, N.; Rubin, J.G. The psychological impact of quarantine and how to reduce it: rapid review of the evidence. Lancet 2020, 395, 912–920.
[13] Murata S, Rezeppa T, Thoma B, et al. The psychiatric sequelae of the COVID-19 pandemic in adolescents, adults, and health care workers. Depress Anxiety. 2021;38(2):233-246.
[14] Stavridou A, Kapsali E, Panagouli E, et al. Obesity in Children and Adolescents during COVID-19 Pandemic. Children (Basel). 2021;8(2).
[15] Wang J, Li Y, Musch DC, et al. Progression of Myopia in School-Aged Children After COVID-19 Home Confinement. JAMA Ophthalmol. 2021.
[16] Vagge A, Giannaccare G, Scarinci F, et al. Acute Acquired Concomitant Esotropia From Excessive Application of Near Vision During the COVID-19 Lockdown. J Pediatr Ophthalmol Strabismus. 2020;57:e88-e91.
[17] Wong CW, Tsai A, Jonas JB, et al. Digital Screen Time During the COVID-19 Pandemic: Risk for a Further Myopia Boom? Am J Ophthalmol. 2020;223:333-337.